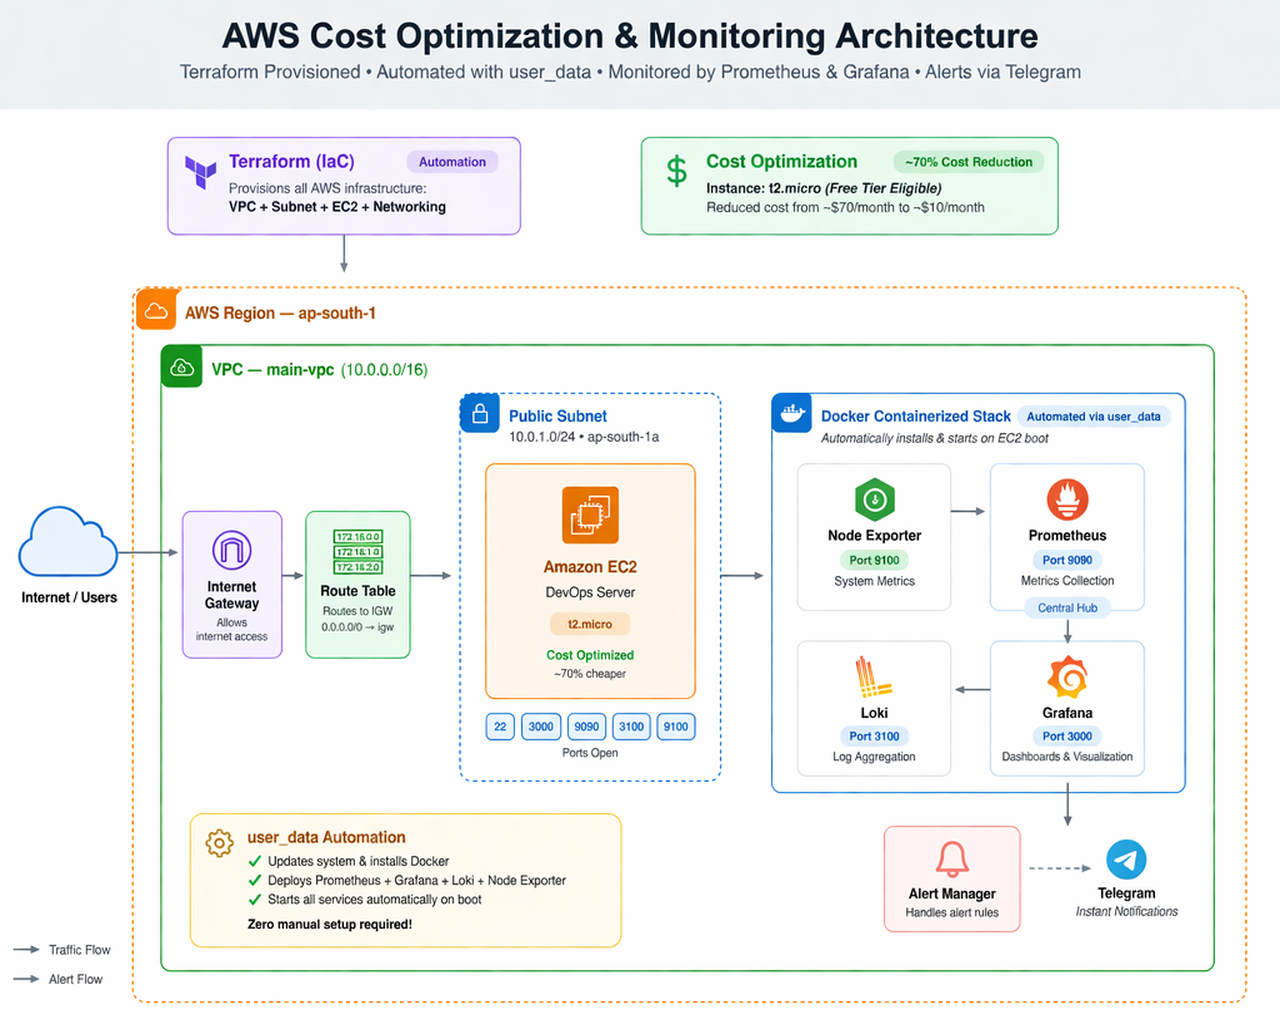
Most early-stage SaaS teams I work with are paying $40–$200/month for monitoring, and using maybe 10% of what they're paying for. Here's the exact stack I deploy instead — Prometheus, Grafana, Loki, and Telegram alerts running on a single t2.micro, fully provisioned by Terraform, with all the code below.
Repo with everything in this post (Terraform modules, docker-compose, alert rules, screenshots): github.com/adarshsingh7470/aws-devops-monitoring-terraform.
If you're running a bootstrapped SaaS on AWS, you've probably hit one of these:
None of those is wrong, exactly. They're just not right-sized for a 5-engineer team running 4 services. You don't need APM with distributed tracing on day one. You need to know when CPU is pegged, when disk fills up, when a container dies, and when a deploy breaks.
Self-hosted Prometheus + Grafana solves all of that for the cost of a single small EC2 instance — if you set it up right. The "if you set it up right" part is where most teams give up. Below is the exact Terraform structure that makes it boring to deploy and boring to maintain.
One t2.micro in a public subnet, running four Docker containers. Node Exporter scrapes the host metrics, Prometheus pulls them every 15 seconds, Grafana visualizes, Loki collects logs, and an alert webhook sends critical events to a Telegram channel that the on-call engineer actually checks.
docker-compose up -d. Whole thing comes up in ~90 seconds from terraform apply.The reason this approach is worth writing about isn't the architecture — it's the math.
For a client running this on the AWS free tier, monitoring genuinely costs them $0 for the first year. After that, ~$8–10/month indefinitely. Compare that to Datadog at $31/host × 6 hosts = $186/month, every month, forever.
Over 12 months of production: $2,232 saved. That's the difference between hiring me for a month-long retainer and getting nothing.
The repo is organized into reusable modules so you can spin up a second monitoring stack (staging, or for a different client) with one variable change:
aws-devops-monitoring-terraform/
├── modules/
│   ├── vpc/
│   │   ├── main.tf
│   │   ├── variables.tf
│   │   └── outputs.tf
│   └── ec2/
│       ├── main.tf
│       ├── variables.tf
│       └── outputs.tf
├── env/
│   └── dev/
│       ├── main.tf
│       ├── terraform.tfvars
│       └── backend.tf
├── docker-compose.yml
├── prometheus.yml
├── alert_rules.yml
├── main.py            # Telegram webhook receiver
└── provider.tf
The split between modules/ (reusable building blocks) and env/dev/ (the actual deployment) is the structure I use on every Terraform project. It separates "how do I build a VPC" from "I want a VPC for the dev environment of project X." When you add staging or prod later, you just add env/staging/ with different tfvars — you don't copy-paste 200 lines of resource blocks.
# modules/vpc/main.tf

resource "aws_vpc" "main" {
  cidr_block           = var.vpc_cidr
  enable_dns_hostnames = true
  enable_dns_support   = true

  tags = {
    Name        = "${var.project}-vpc"
    Environment = var.env
  }
}

resource "aws_subnet" "public" {
  vpc_id                  = aws_vpc.main.id
  cidr_block              = var.public_subnet_cidr
  availability_zone       = var.az
  map_public_ip_on_launch = true

  tags = {
    Name = "${var.project}-public-${var.az}"
  }
}

resource "aws_internet_gateway" "main" {
  vpc_id = aws_vpc.main.id
  tags   = { Name = "${var.project}-igw" }
}

resource "aws_route_table" "public" {
  vpc_id = aws_vpc.main.id

  route {
    cidr_block = "0.0.0.0/0"
    gateway_id = aws_internet_gateway.main.id
  }
}

resource "aws_route_table_association" "public" {
  subnet_id      = aws_subnet.public.id
  route_table_id = aws_route_table.public.id
}
The EC2 module is where most of the action happens. Three things matter: the security group (least-privilege), the IAM role (no static credentials), and the user_data bootstrap.
# modules/ec2/main.tf

data "aws_ami" "amazon_linux" {
  most_recent = true
  owners      = ["amazon"]

  filter {
    name   = "name"
    values = ["al2023-ami-*-x86_64"]
  }
}

resource "aws_security_group" "monitoring" {
  name   = "${var.project}-monitoring-sg"
  vpc_id = var.vpc_id

  ingress {
    description = "SSH (restricted)"
    from_port   = 22
    to_port     = 22
    protocol    = "tcp"
    cidr_blocks = [var.allowed_ssh_cidr]
  }

  ingress {
    description = "Grafana"
    from_port   = 3000
    to_port     = 3000
    protocol    = "tcp"
    cidr_blocks = ["0.0.0.0/0"]
  }

  ingress {
    description = "Prometheus"
    from_port   = 9090
    to_port     = 9090
    protocol    = "tcp"
    cidr_blocks = ["0.0.0.0/0"]
  }

  ingress {
    description = "Node Exporter (VPC only)"
    from_port   = 9100
    to_port     = 9100
    protocol    = "tcp"
    cidr_blocks = [var.vpc_cidr]
  }

  ingress {
    description = "Loki (VPC only)"
    from_port   = 3100
    to_port     = 3100
    protocol    = "tcp"
    cidr_blocks = [var.vpc_cidr]
  }

  egress {
    from_port   = 0
    to_port     = 0
    protocol    = "-1"
    cidr_blocks = ["0.0.0.0/0"]
  }
}

resource "aws_iam_role" "monitoring" {
  name = "${var.project}-monitoring-role"

  assume_role_policy = jsonencode({
    Version = "2012-10-17"
    Statement = [{
      Effect = "Allow"
      Principal = { Service = "ec2.amazonaws.com" }
      Action = "sts:AssumeRole"
    }]
  })
}

resource "aws_iam_role_policy_attachment" "ssm" {
  role       = aws_iam_role.monitoring.name
  policy_arn = "arn:aws:iam::aws:policy/AmazonSSMManagedInstanceCore"
}

resource "aws_iam_instance_profile" "monitoring" {
  name = "${var.project}-monitoring-profile"
  role = aws_iam_role.monitoring.name
}

resource "aws_instance" "monitoring" {
  ami                    = data.aws_ami.amazon_linux.id
  instance_type          = "t2.micro"
  subnet_id              = var.subnet_id
  vpc_security_group_ids = [aws_security_group.monitoring.id]
  iam_instance_profile   = aws_iam_instance_profile.monitoring.name
  key_name               = var.key_name

  user_data = templatefile("${path.module}/user_data.sh", {
    config_bucket = var.config_bucket
  })

  root_block_device {
    volume_size = 30
    volume_type = "gp3"
    encrypted   = true
  }

  tags = {
    Name = "${var.project}-monitoring"
  }
}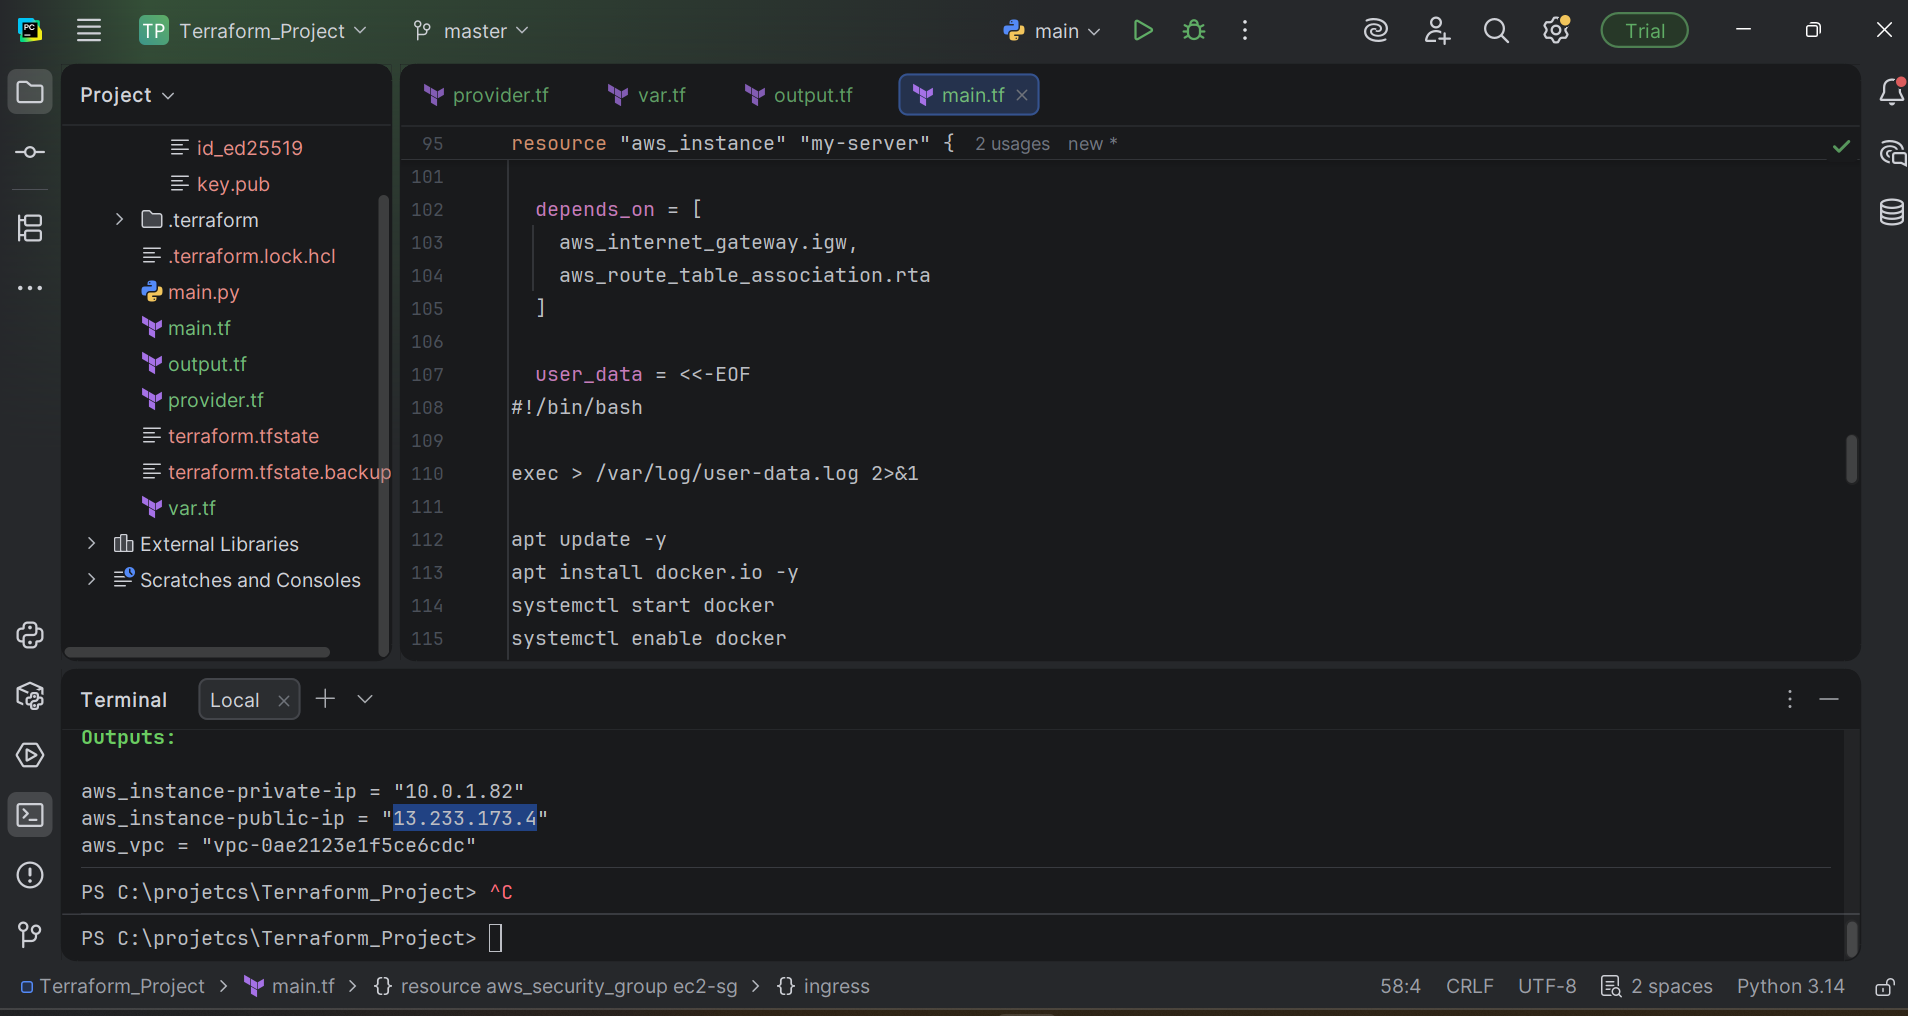
terraform apply output — VPC, subnet, security group, IAM role, and EC2 created cleanly. Whole stack stands up in roughly 90 seconds.This script runs once on first boot. It installs Docker, pulls the config from S3 (you've already uploaded docker-compose.yml, prometheus.yml, and alert_rules.yml there during terraform apply), and starts the stack. By the time SSH is responsive, the monitoring is already running.
#!/bin/bash
set -euo pipefail

dnf update -y
dnf install -y docker
systemctl enable --now docker
usermod -aG docker ec2-user

# Install docker-compose v2
curl -L "https://github.com/docker/compose/releases/download/v2.24.0/docker-compose-$(uname -s)-$(uname -m)" \
  -o /usr/local/bin/docker-compose
chmod +x /usr/local/bin/docker-compose

mkdir -p /opt/monitoring
cd /opt/monitoring

# Fetch configs from S3 — IAM role grants the access
aws s3 cp s3://${config_bucket}/docker-compose.yml .
aws s3 cp s3://${config_bucket}/prometheus.yml .
aws s3 cp s3://${config_bucket}/alert_rules.yml .

docker-compose up -dFour containers, declared in one file. This is the entire docker-compose:
# docker-compose.yml

version: "3.8"

services:
  prometheus:
    image: prom/prometheus:v2.48.0
    container_name: prometheus
    ports:
      - "9090:9090"
    volumes:
      - ./prometheus.yml:/etc/prometheus/prometheus.yml
      - ./alert_rules.yml:/etc/prometheus/alert_rules.yml
      - prometheus_data:/prometheus
    command:
      - "--config.file=/etc/prometheus/prometheus.yml"
      - "--storage.tsdb.retention.time=15d"
    restart: unless-stopped

  grafana:
    image: grafana/grafana:10.2.2
    container_name: grafana
    ports:
      - "3000:3000"
    volumes:
      - grafana_data:/var/lib/grafana
    environment:
      - GF_SECURITY_ADMIN_PASSWORD=${GRAFANA_ADMIN_PASSWORD}
    restart: unless-stopped

  node-exporter:
    image: prom/node-exporter:v1.7.0
    container_name: node-exporter
    ports:
      - "9100:9100"
    volumes:
      - /proc:/host/proc:ro
      - /sys:/host/sys:ro
      - /:/rootfs:ro
    command:
      - "--path.procfs=/host/proc"
      - "--path.sysfs=/host/sys"
      - "--collector.filesystem.mount-points-exclude=^/(sys|proc|dev|host|etc)($$|/)"
    restart: unless-stopped

  loki:
    image: grafana/loki:2.9.3
    container_name: loki
    ports:
      - "3100:3100"
    volumes:
      - loki_data:/loki
    restart: unless-stopped

volumes:
  prometheus_data:
  grafana_data:
  loki_data: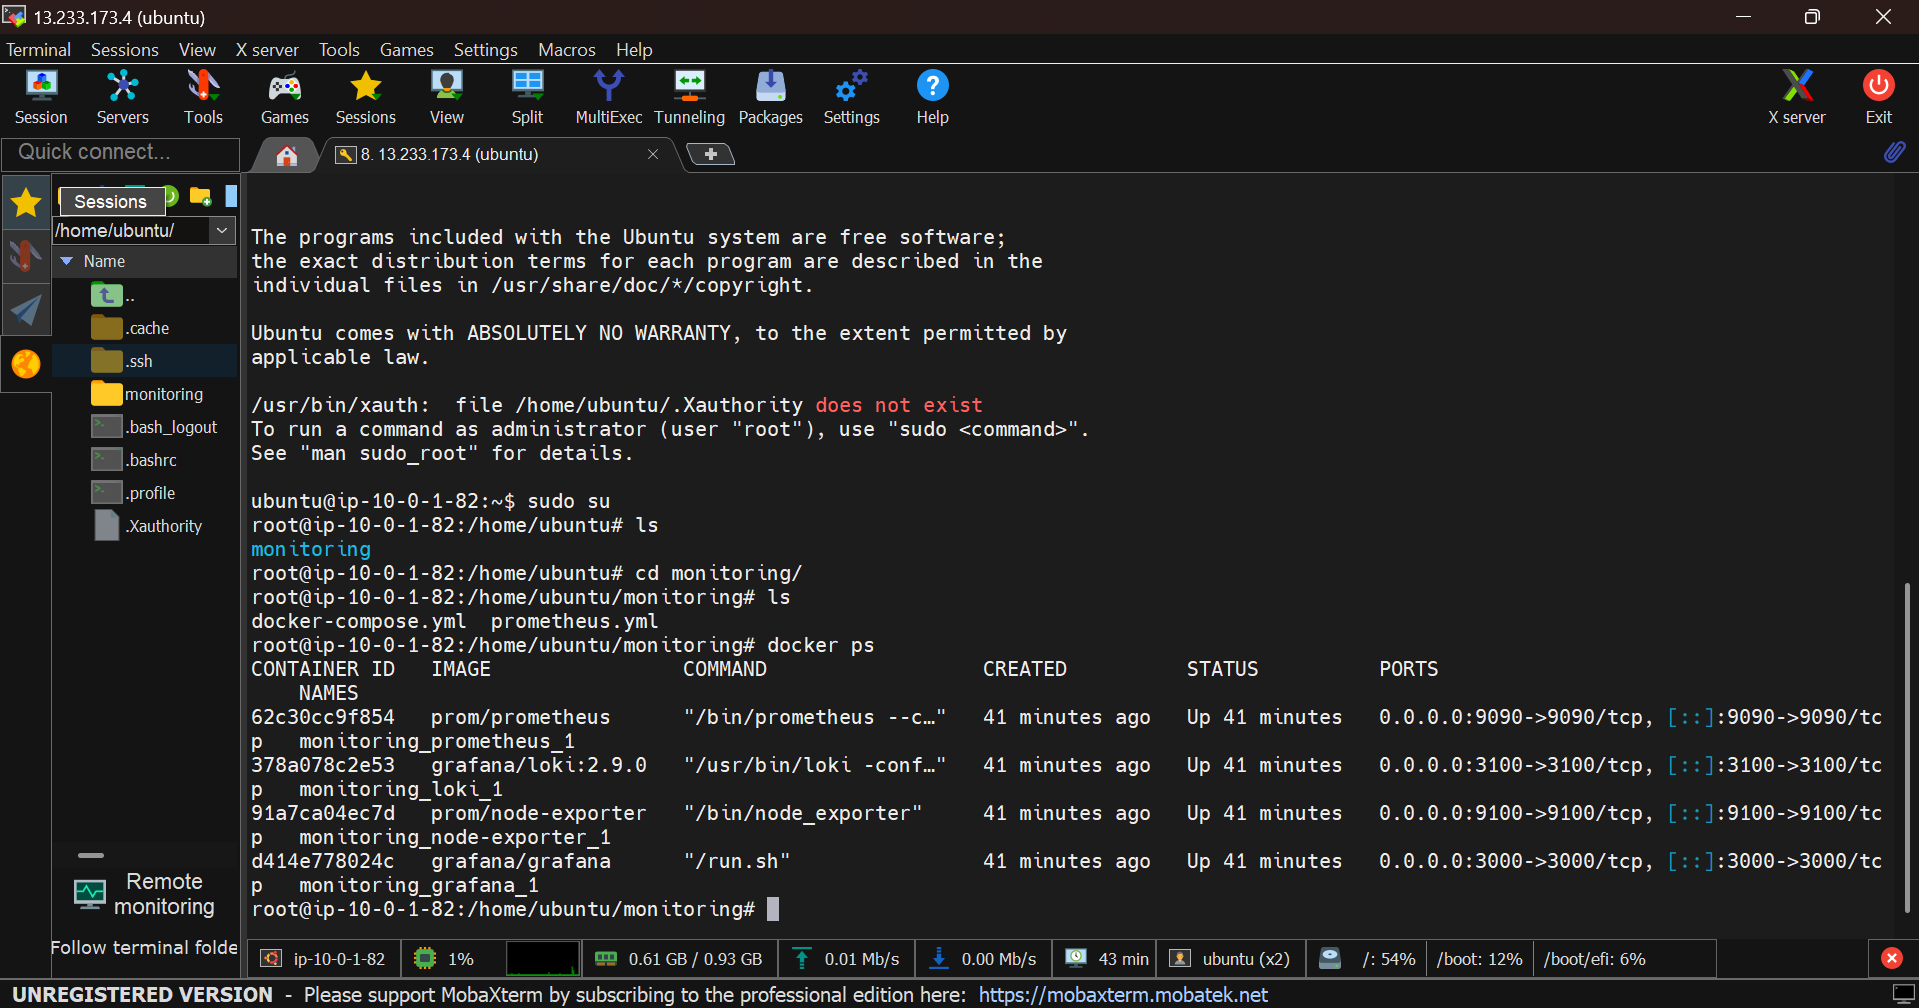
docker ps on the EC2 host — Prometheus, Grafana, Node Exporter, and Loki all running.15-second scrape interval is the sweet spot. Faster than that and the t2.micro starts feeling it; slower and you miss short spikes.
# prometheus.yml

global:
  scrape_interval: 15s
  evaluation_interval: 15s

rule_files:
  - "alert_rules.yml"

scrape_configs:
  - job_name: "prometheus"
    static_configs:
      - targets: ["localhost:9090"]

  - job_name: "node"
    static_configs:
      - targets: ["node-exporter:9100"]
        labels:
          host: "monitoring-server"

  # Add additional targets here as you scale
  # - job_name: "app-servers"
  #   static_configs:
# - targets: ["10.0.1.20:9100", "10.0.1.21:9100"]The dashboard is for understanding what's happening. The alerts are for catching what you're not watching. I always set three baseline alerts on every box: CPU, memory, and disk. They cover 80% of "the box is dying" scenarios.
# alert_rules.yml

groups:
  - name: system_alerts
    rules:
      - alert: HighCPUUsage
        expr: 100 - (avg by(instance) (rate(node_cpu_seconds_total{mode="idle"}[5m])) * 100) > 80
        for: 2m
        labels:
          severity: warning
        annotations:
          summary: "High CPU on {{ $labels.instance }}"
          description: "CPU usage above 80% for 2+ minutes (current: {{ $value | printf \"%.1f\" }}%)"

      - alert: HighMemoryUsage
        expr: (1 - (node_memory_MemAvailable_bytes / node_memory_MemTotal_bytes)) * 100 > 80
        for: 2m
        labels:
          severity: warning
        annotations:
          summary: "High memory on {{ $labels.instance }}"
          description: "Memory usage above 80% (current: {{ $value | printf \"%.1f\" }}%)"

      - alert: HighDiskUsage
        expr: (1 - (node_filesystem_avail_bytes{fstype!="tmpfs"} / node_filesystem_size_bytes{fstype!="tmpfs"})) * 100 > 80
        for: 5m
        labels:
          severity: critical
        annotations:
          summary: "Disk usage high on {{ $labels.instance }}"
          description: "{{ $labels.mountpoint }} is at {{ $value | printf \"%.1f\" }}%"

      - alert: InstanceDown
        expr: up == 0
        for: 1m
        labels:
          severity: critical
        annotations:
          summary: "Target {{ $labels.instance }} is down"
The for: 2m clause is critical — it prevents flappy alerts. CPU spikes for 30 seconds during a deploy are not an incident. CPU at 90% for 2 minutes is.
Why Telegram and not PagerDuty / Slack? Because the people I work with already have Telegram open. Slack notifications get lost. PagerDuty is overkill for a 5-engineer team. Telegram pushes through to the lock screen and someone always sees it.
The webhook receiver is a tiny Flask app that takes Prometheus alert payloads and forwards them to a Telegram bot:
# main.py — runs as a fifth container or a systemd service

import os
import requests
from flask import Flask, request

app = Flask(__name__)

BOT_TOKEN = os.environ["TELEGRAM_BOT_TOKEN"]
CHAT_ID   = os.environ["TELEGRAM_CHAT_ID"]

SEVERITY_EMOJI = {
    "critical": "🚨",
    "warning":  "⚠️",
    "info":     "ℹ️",
}

@app.route("/alert", methods=["POST"])
def receive_alert():
    payload = request.get_json(force=True)

    for alert in payload.get("alerts", []):
        if alert.get("status") != "firing":
            continue

        severity = alert["labels"].get("severity", "info")
        emoji    = SEVERITY_EMOJI.get(severity, "•")

        msg = (
            f"{emoji} *{alert['labels']['alertname']}*\n"
            f"Severity: `{severity}`\n"
            f"Instance: `{alert['labels'].get('instance', 'unknown')}`\n\n"
            f"{alert['annotations'].get('summary', '')}\n"
            f"_{alert['annotations'].get('description', '')}_"
        )

        requests.post(
            f"https://api.telegram.org/bot{BOT_TOKEN}/sendMessage",
            json={"chat_id": CHAT_ID, "text": msg, "parse_mode": "Markdown"},
            timeout=5,
        )

    return "ok", 200

if __name__ == "__main__":
    app.run(host="0.0.0.0", port=5000)
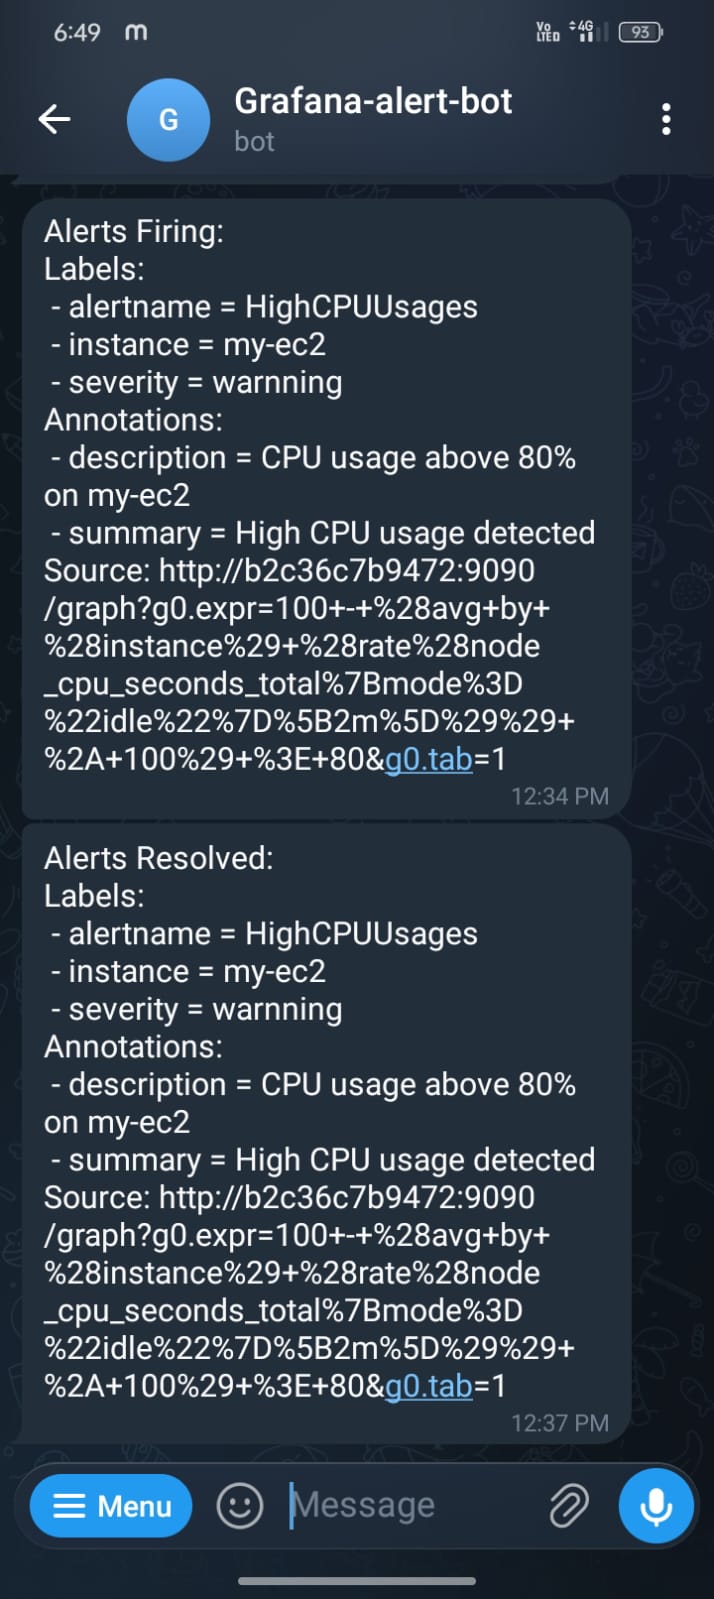
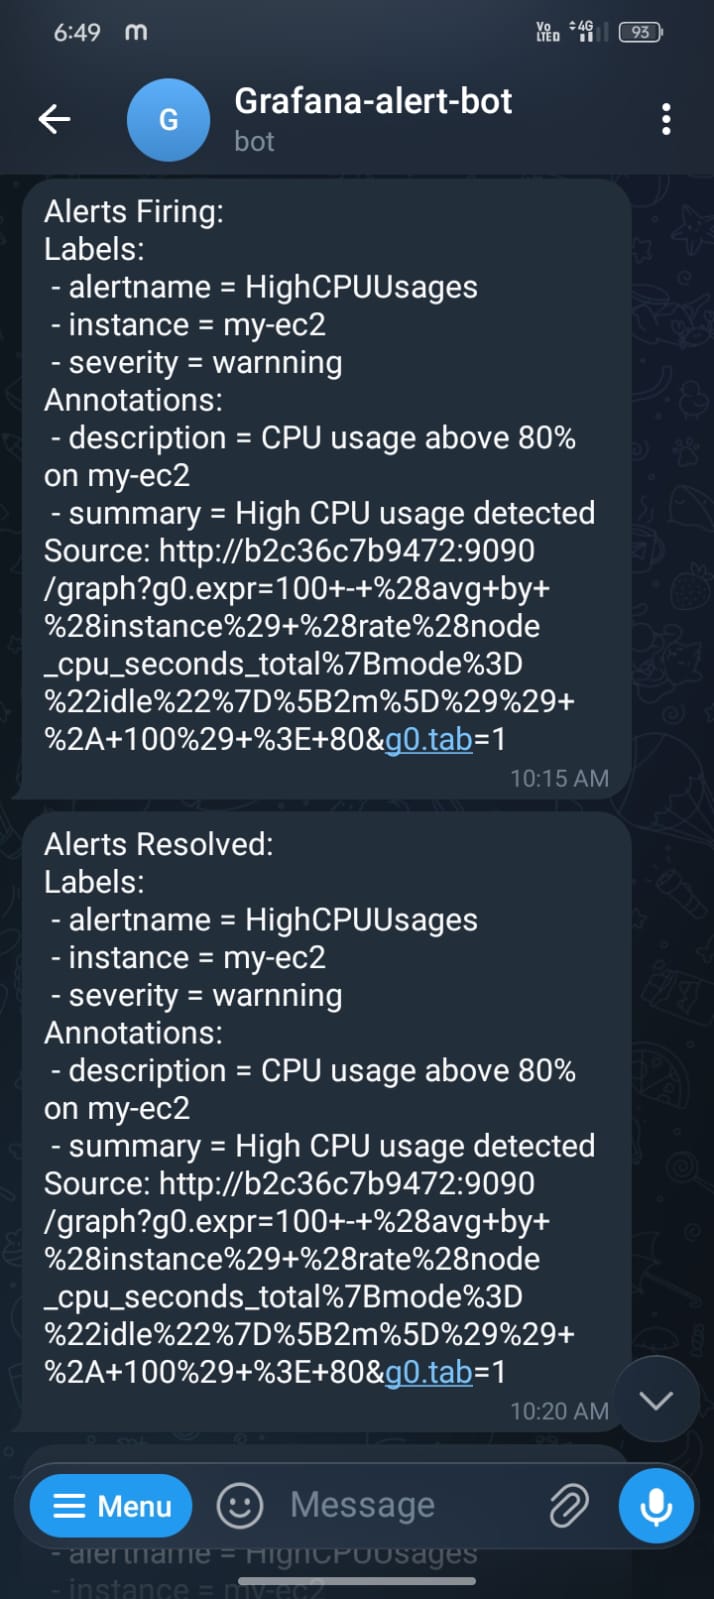
Real alerts firing in the channel:
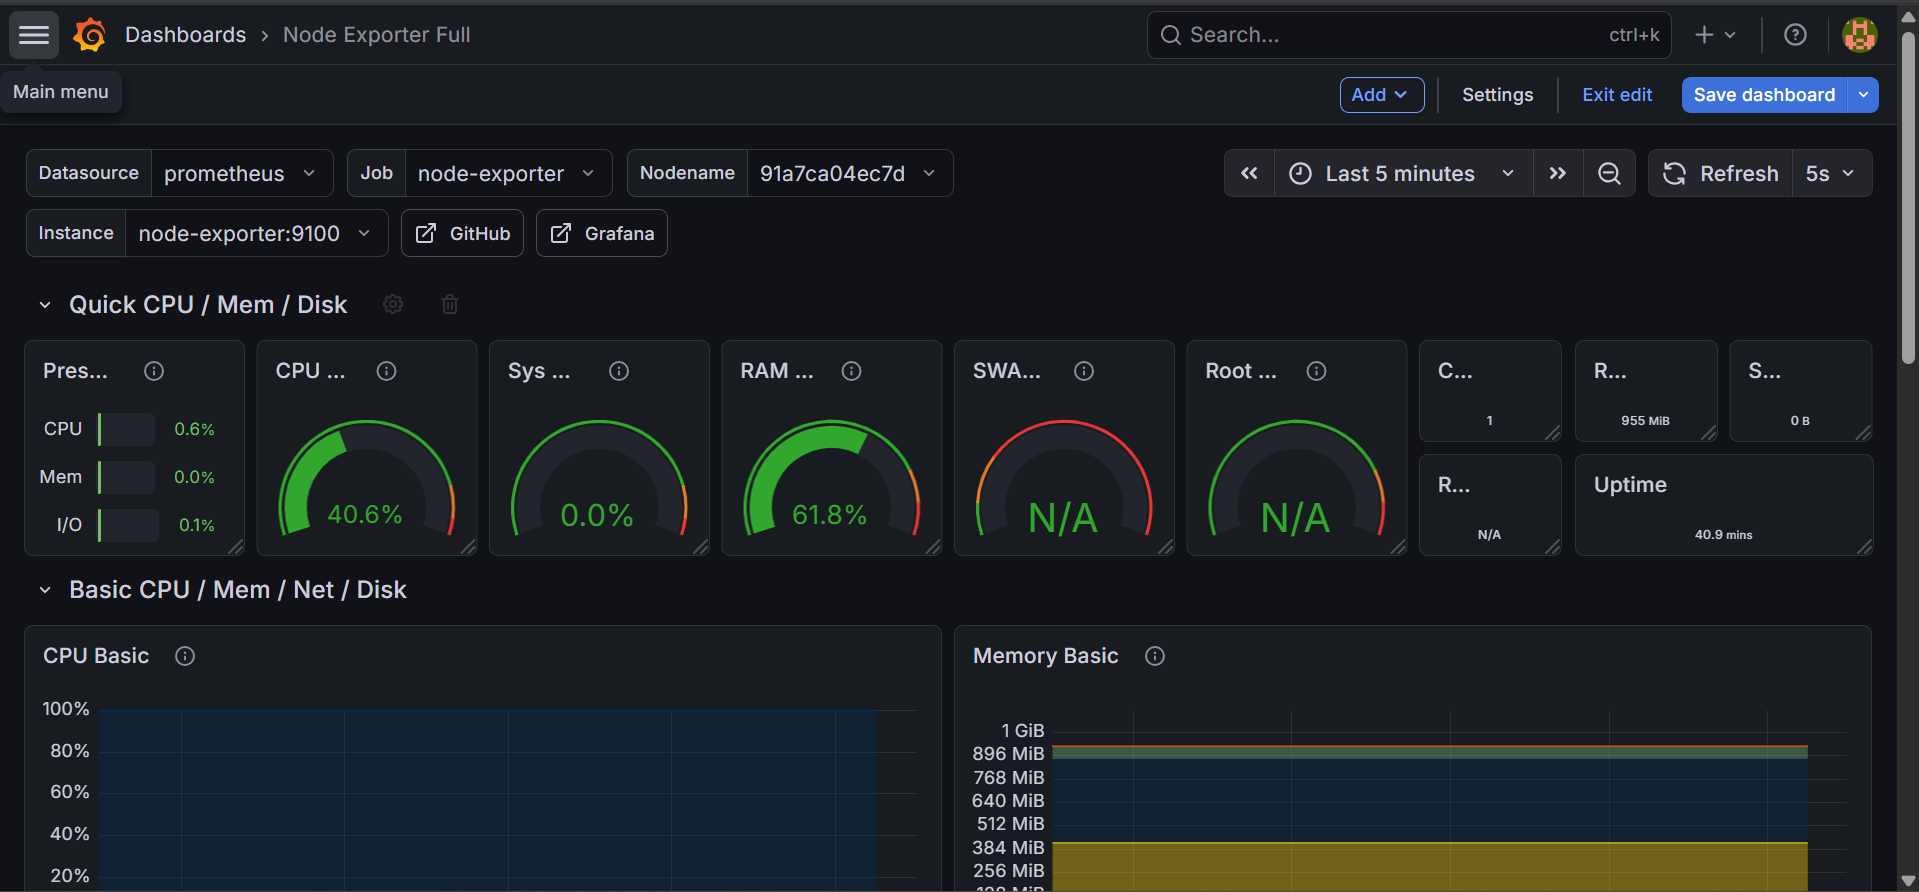
Three dashboards cover 95% of what a small team actually needs day-to-day:
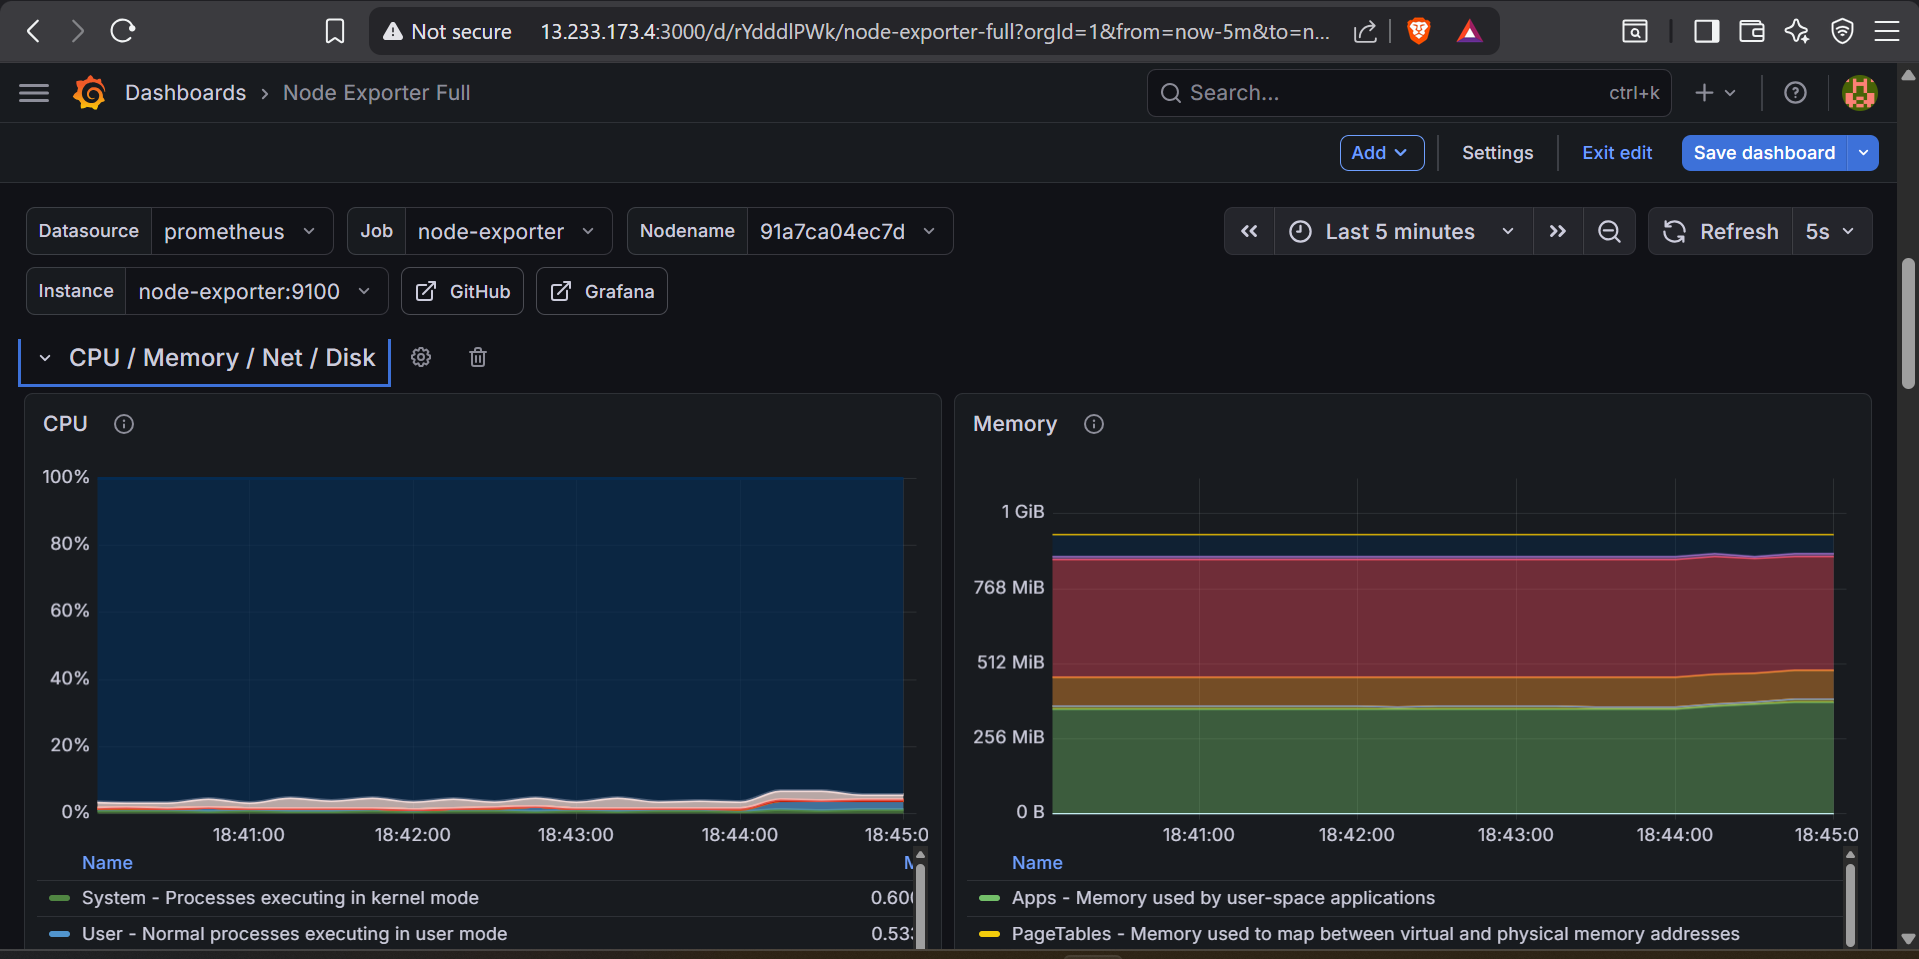
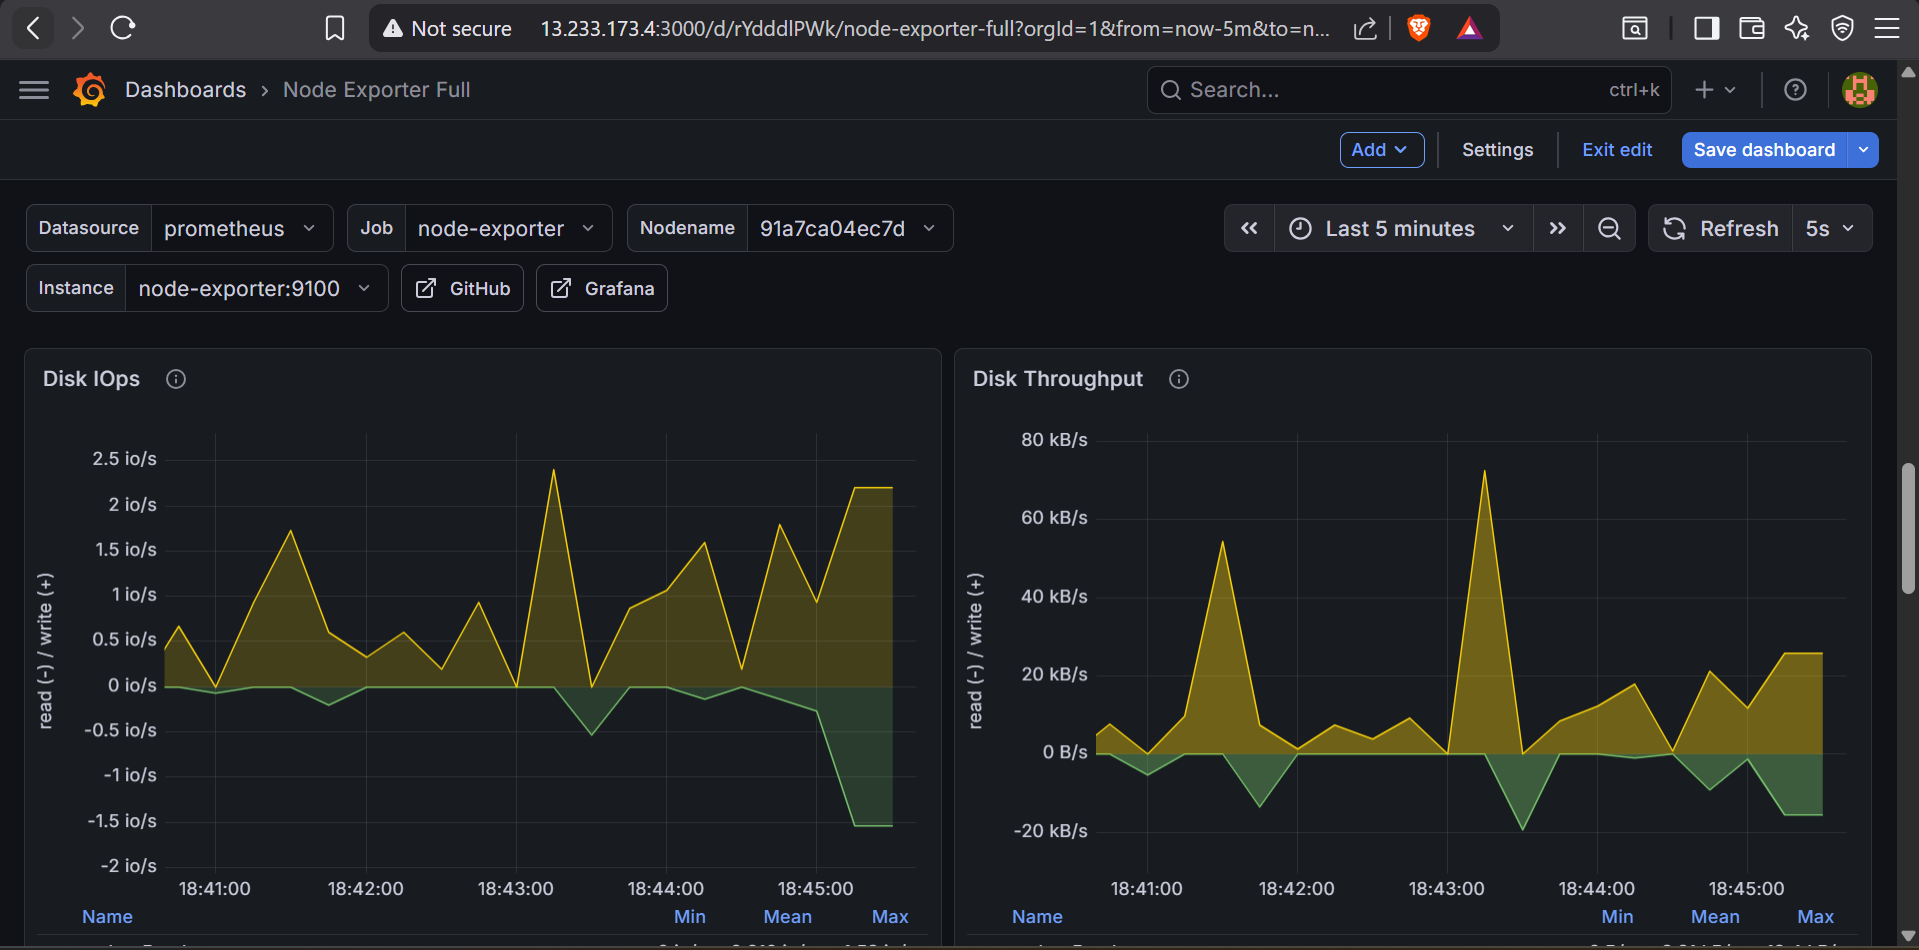
/var/lib/docker is usually the one that fills up first.Three things I changed after running this stack in production for several months:
The first version of this opened port 3000 to 0.0.0.0/0. That's fine for a demo, not for production. The second version puts Grafana behind an Application Load Balancer with a Cognito authorizer, or at minimum behind Cloudflare Access. The Grafana login page is brute-forced constantly if you leave it exposed.
Local terraform.tfstate is a footgun. The repo's backend.tf should always be:
terraform {
  backend "s3" {
    bucket         = "my-terraform-state-{account}"
    key            = "monitoring/dev/terraform.tfstate"
    region         = "us-east-1"
    dynamodb_table = "terraform-locks"
    encrypt        = true
  }
}
This means two engineers can't apply at the same time and clobber each other's state.
The current setup sends every alert directly to Telegram. That's fine until you get the same alert firing every 30 seconds during an incident, spamming the channel. Alertmanager adds grouping, inhibition, and silence windows — the difference between actionable signal and notification fatigue.
I'm not pretending self-hosted monitoring is universally better. It's not. Three situations where I'd recommend you pay for SaaS instead:
For everyone else — bootstrapped SaaS teams, indie dev shops, internal tools at small companies — this stack is the right answer. It's $0–10/month, fully under your control, and you can hand the whole thing off in a single Terraform repo.
If you're a bootstrapped SaaS founder reading this and thinking "yes, I want exactly this" — that's literally what my $299 audit + Reliability & Scaling project covers. I'll deploy this stack in your account, configure it for your workload, and hand it off with a Loom walkthrough so your team owns it cold.
See my services →Questions about the code? Email me at hello@adarshportfolio.site or open an issue on the GitHub repo.